
There are 3 rivers in this area of Northern Victoria – Goulburn River, Murray River and Campaspe River. To plan with confidence, it is important to understand the risk of those rivers flooding over bike routes.
- Why Create Bike Routes on Floodplains?
- Goulburn River Flooding
- Murray River Flooding
- Campaspe River Flooding.
- Outro
Why Create Bike Routes on Floodplains?
This is an important question – if the tracks flood why not just create routes that don’t flood?
The floodplains tracks provide a great ride experience. Dirt tracks and natural forest are highlights where you can enjoy river views and free camping. The area has many native animals and birds, and minimal vehicle traffic.
The river floodplain Parks also allow riders to avoid developed urban areas unless the riders want to stop for amenities.
For example, the ERI route passes through the middle of Shepparton / Mooroopna. See the red line on the map to the right. This allows the ERI to avoid the traffic and urban development arising from a city of 50,000 people.

However, it is important to understand why these floodplains still exist. Floodplains are low lying natural areas along the river banks. These low areas are the first to flood as the river rises. It is expensive to build up and develop the floodplains and make the ground higher than previous flood levels. Therefore, floodplains are often left till last to develop or are only used for recreation.
Moreover, leaving floodplains open and undeveloped is a flood mitigation strategy. When a flooding river spreads out onto its floodplain, the floodplain provides an emergency storage channel for the floodwater. This prevents higher river levels and water flow speeds which would cause more damage to nearby developed areas.
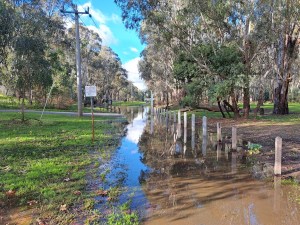
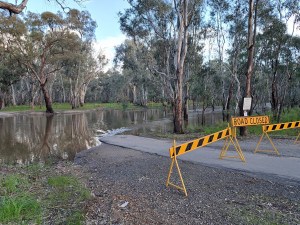
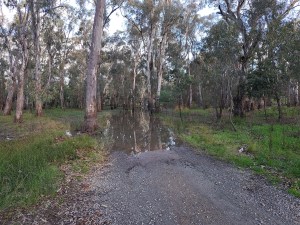
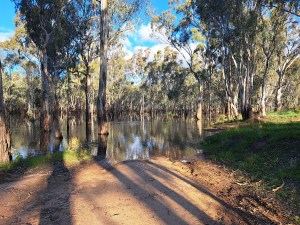
The photos below show parts of the ERI route flooded in 2022 (click on any image to open slideshow).
An added complication is the Murray Darling Basin Plan (MDBP). This plan added more water into the Goulburn River for four reasons.
- Firstly, the MDBP added environmental flows into the Goulburn to raise the river level.
- Secondly, the MDBP moved water for irrigation into the Goulburn River. Previously, local irrigation had used a separate system of dedicated channels and storages.
- Thirdly, the MDBP allowed private ownership of water separate from land-holding and beyond the current year. This means more water is stored in Lake Eildon, and for longer periods. In wet years, two things happen. First, river levels are higher. Second, Eildon Dam is now more likely to fill and have to release even more water into the high rivers.
- Finally, the MDBP was developed as a plan for addressing forecasts of reducing rainfall and ongoing water scarcity. The Plan did not consider the full implications of its changes in seasons when there would be above average rainfall.
Environmental water releases from Lake Eildon are intended to raise the Goulburn River water level. Sometimes, the water level is raised high enough to overflow the river’s banks onto the floodplain. This is deliberate and often done in early spring to stimulate plant growth on the banks and floodplain. This flush also improves river water quality and encourages native fish to breed.
This means riders need to monitor local rainfall records, River levels and Dam releases when planning rides.
Use the following links to monitor Goulburn River levels:
- Water Releases from Lake Eildon. Water releases for environmental flows or irrigation can cause more flooding of Goulburn River ERI tracks than local rainfall.
- Goulburn River at Shepparton. The local floodplain ERI tracks are usually dry if the river level has not been above 6 metres recently.
- Goulburn River at McCoys Bridge. McCoys bridge is about half way between Echuca and Shepparton. The local floodplain ERI tracks are usually dry if the river level has not been above 6 metres recently.
Riders should monitor river levels themselves; do not rely on media reports. Often Media does not report inundation of floodplain (including ERI tracks) when flooding is below the “minor flood” level. The terms “minor flood” or “minor flood warning” usually refer to flood water reaching the boundaries of private properties.
.
Goulburn River Flooding
Flooding from the Goulburn River is the main risk to the ERI tracks. The Murray River and Campaspe Rivers can flood causing implications to the ERI route, but these are less significant. Flooding in these rivers is covered below.
The ERI track can be flooded, mainly on the stage between Echuca and Murchison which runs along the Goulburn River. When the Goulburn River level is 6m or higher, then parts of the ERI tracks might be flooded.
Let’s look at the actual long term river level stats. The graph below analyses 50 years of daily river level data from McCoys Bridge. McCoys Bridge crosses the Goulburn River about half way between Echuca and Shepparton.
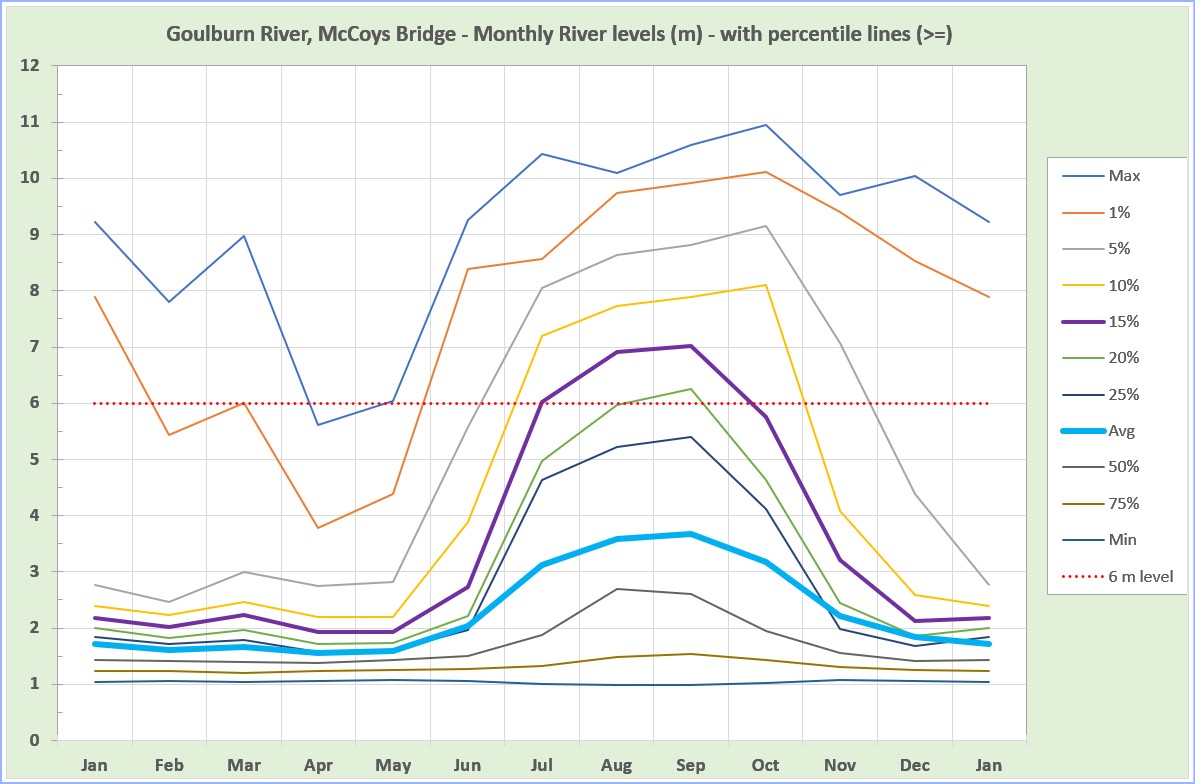
This is a complicated graph. It can be used to estimate the likelihood of the river level at McCoys Bridge being above a certain level. This is how you read it – using examples from September and November months.
- Look at the thick blue line, designated Avg. This shows the average level in September is 3.7m.
- Look at the purple line, designated 15%. This shows that 15% of all the daily levels recorded in September, over 50 years, were 7m or higher.
- Look at the orange line, designated 1%. This shows that only 1% of all the daily levels records in September, over 50 years, were 9.9m or higher.
- Look at the yellow line, designated 10%. This shows that only 10% of all the daily levels in November were 4.1m or higher.
- Look at the orange line, designated 1%. This shows that only 1% of all the daily levels in November were 9.4m or higher.
We can estimate the likelihood of flooding from these lines.
First we need to understand that monthly flood statistics are understood in a different way to the monthly weather statistics. In weather there is a lot of short term fluctuation (over days, weeks, months), but less variations over years. For example, in December Bendigo averages 3 days over 35’C. But over many years this doesn’t change much – Bendigo will have 1-5 days over 35’C in December every year. On average, 10% of the days in every December will be over 35’C.
However, with flooding, there is not much variation in the river level over days or weeks. But there is a lot more variation between years.
For example, we just saw that only 10% of all the daily levels in November were 4.1m or higher. But this does not mean 10% of days in every November are above the 4.1m level. A more likely reading is that 1 year in 10, every day of November will be above the 4.1m level. But for the other 9 years, no days in November will be above 4.1m level.
Similarly, we saw that 1% of the all the daily levels in November were 9.4m or higher. This suggests that perhaps for only 1 year in 100 levels in November will be above 9.4m, but the other 99 years they would probably be lower.
The 6m level is marked on the graph with a red dotted line. In theory, we can now calculate the likelihood McCoys Bridge level will be above that 6m line in any month.
The image below shows McCoys Bridge with a river level of 9.3m in November 2022.
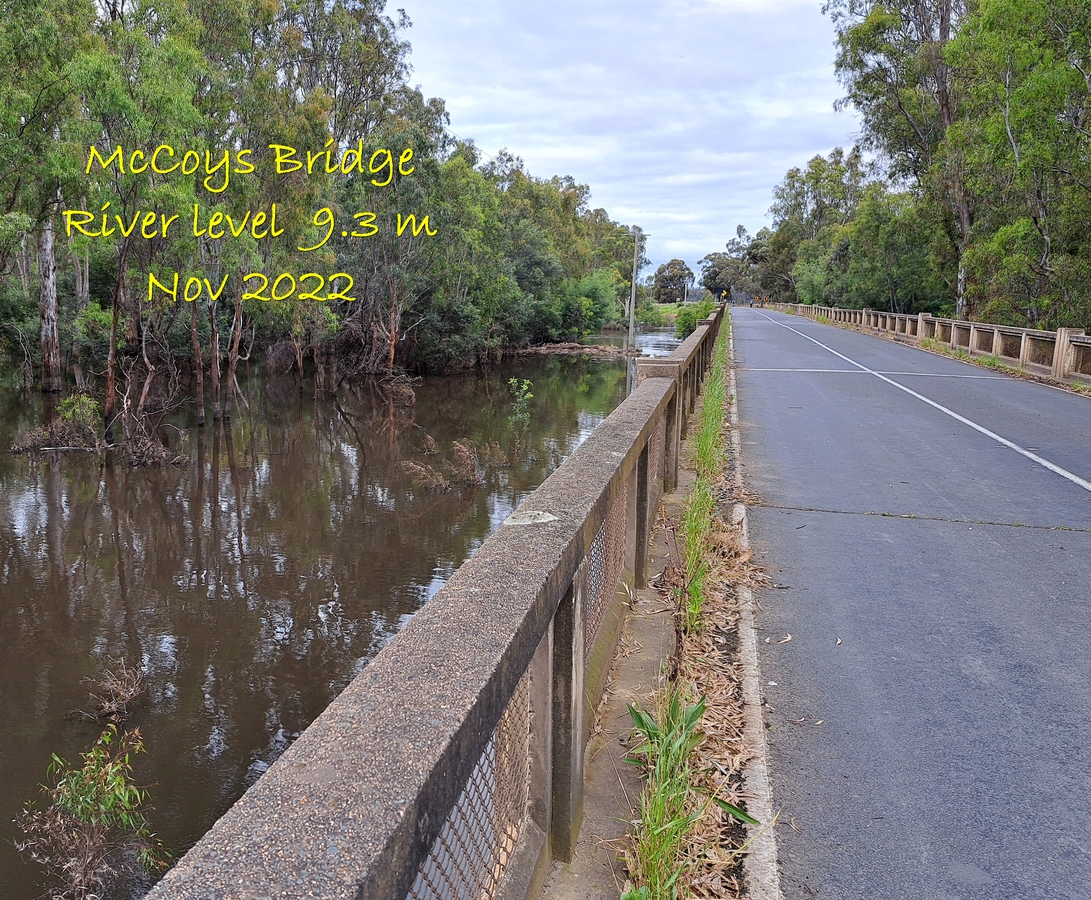
The data suggests this is a very rare event. Just over 1% likelihood, close to a 100 year event. But is this true?
Get a firm grip on your handlebars. This ride is going to get more technical.
Since launching the Yellowbelly Track in February 2021, I became concerned it was getting flooded regularly. Moreover, the track was being flooded more often and at different times than the data suggested it should be. See the recent list of high river levels below.
- 2021 – September (6.6m).
- 2022 – September (7.9m), October (10.6m), November (9.7m), December (8.8m).
- 2023 – June (8.3m), July (8.5m), August (7.0m), October (8.7m).
- 2024 – January (9.2m)
Perhaps something happened and the old data patterns didn’t apply any more. In data nerd terms this is called a discontinuity. We need to investigate what might have changed over the last 50 years of data.
On thing that has changed is the introduction of the Murray Darling Basin Plan (MDBP) discussed above.
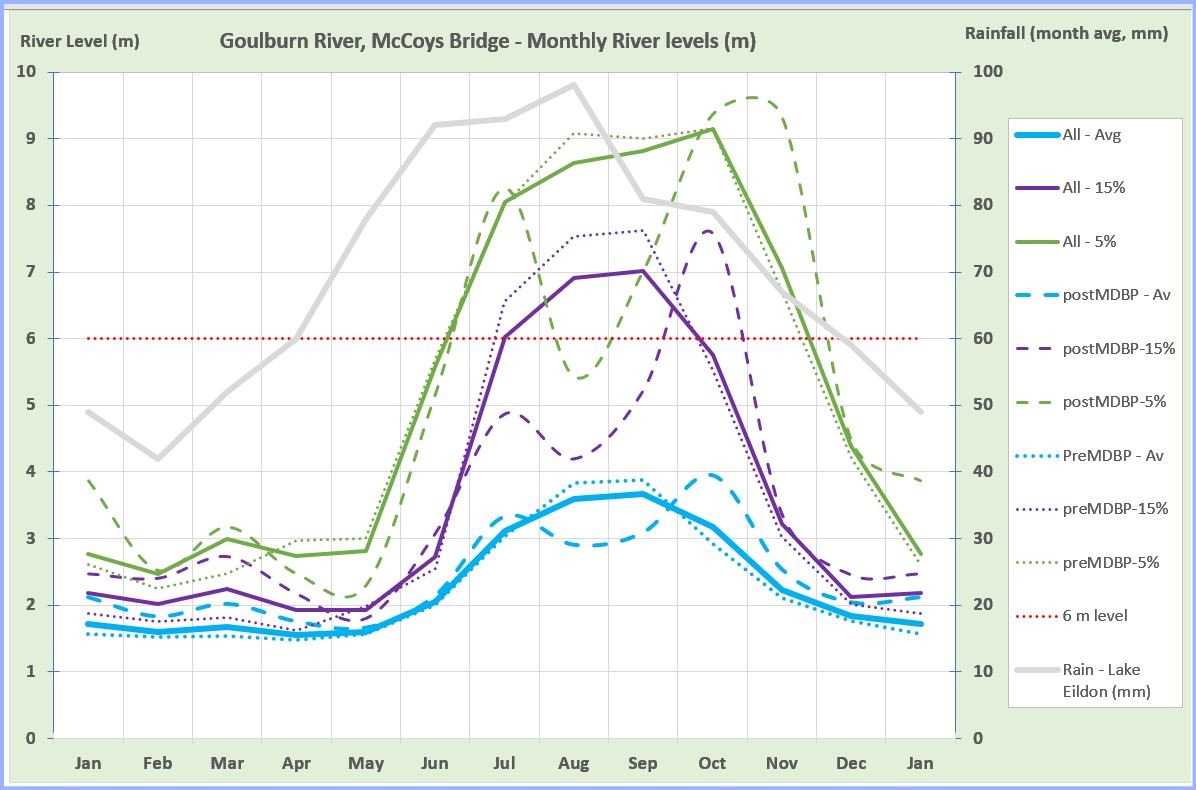
I split the data set into 2 blocks. Almost 40 years of data before the MDBP was introduced at the start of 2013. And over 12 years of data since the MDBP was introduced. The results comparing the 2 datasets are shown in the graph below.
- For all the likelihood categories:
- the solid line indicates the full dataset,
- the dashed line shows the post-MDBP dateset,
- the dotted line shows the pre-MDBP dataset.
- Look at the blue lines first. The blue lines show the average monthly levels for each data set. The set of 3 blue lines show –
- The pre-MDBP low river levels from December to April are higher post MBDP. This is expected given the environmental aims of the MDBP.
- Conversely, the pre-MDBP peak river levels in August and September are lower post MDBP.
- Post MDBP there is spike in October river level. This is now the highest level in the year.
- Now look at the purple lines. The purple lines show the level where only 15% of all the daily levels are higher than this. The set of 3 purple lines show a similar pattern –
- The pre-MDBP low river levels from December to April are higher post-MDBP.
- The pre-MDBP peak river levels in August and September are lower post MDBP.
- Post MDBP there is spike in October river level. This is now the highest level in the year.
- Now look at the green lines. The green lines show the level where only 5% of all the daily levels are higher than this. The set of 3 green lines show a similar pattern –
- The pre-MDBP low river levels from December to March are higher post-MDBP.
- The pre-MDBP peak river levels in August and September are lower post MDBP.
- Post MDBP there is spike in the October and November river levels. These is now the highest level in the year.
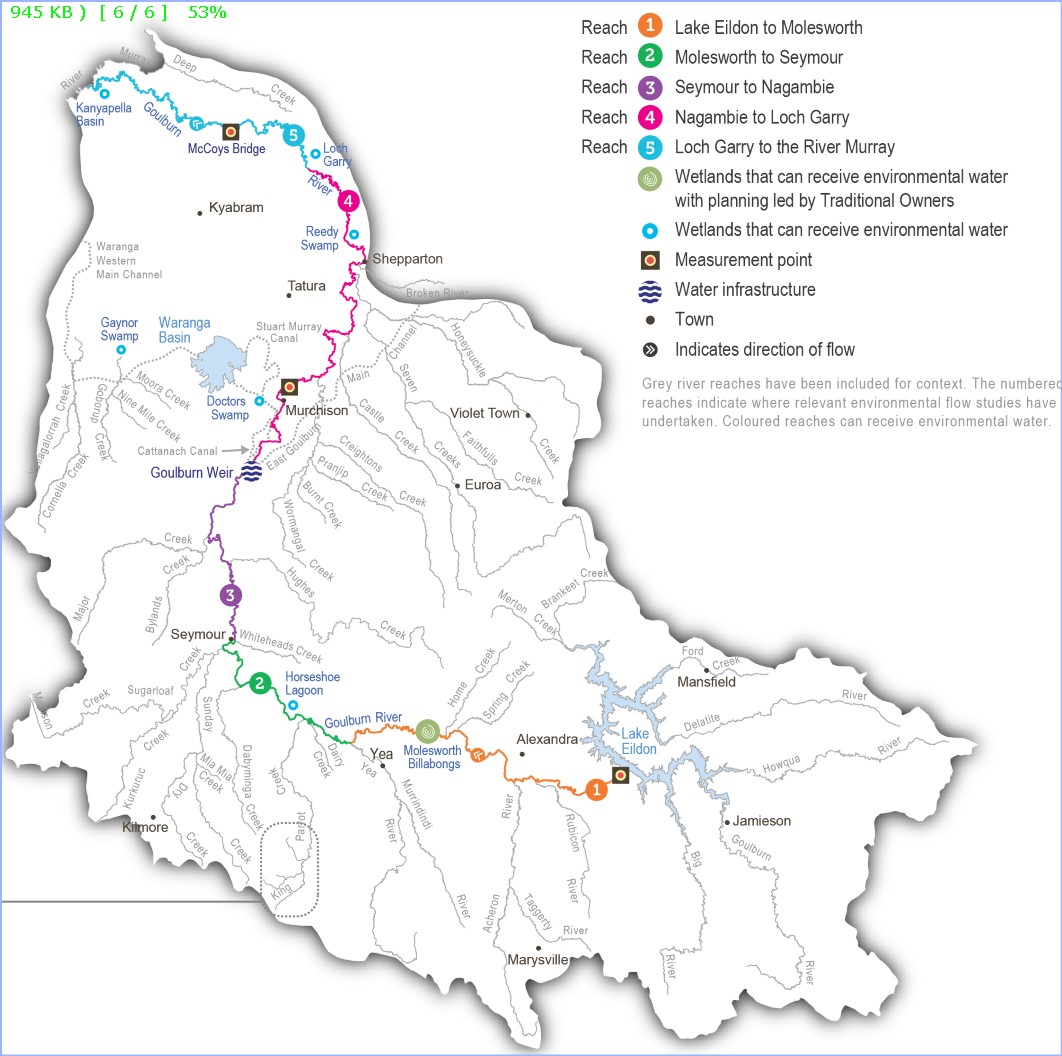
The main cause of this is changes to irrigation practice, rather environmental releases. The Goulburn River is fed primarily by rainfall. Its catchment does not have much snow melt. The heaviest rainfall areas are around Toolangi and Marysville over 100km south of Nagambie. This rainfall bypasses Eildon Dam and comes into the Goulburn via other rivers (e.g. Yea and Acheron). The rainfall from Toolangi is highest over the spring period August to November. See images showing the Goulburn Catchment and Rainfall below.

Lake Eildon is required by legislation to be full at the start of the irrigation season. It does not do flood mitigation. The MDBP prioritised the Goulburn River as a major irrigation channel. This led to the decommissioning of other local water storages.
Now at the start of spring when irrigation and environmental flows start, there is no storage capacity buffer. A full dam does not act as a dam, it has to pass new inflows straight through. The lower Goulburn River is now very vulnerable to flooding when there is excess spring rainfall around the Toolangi area.
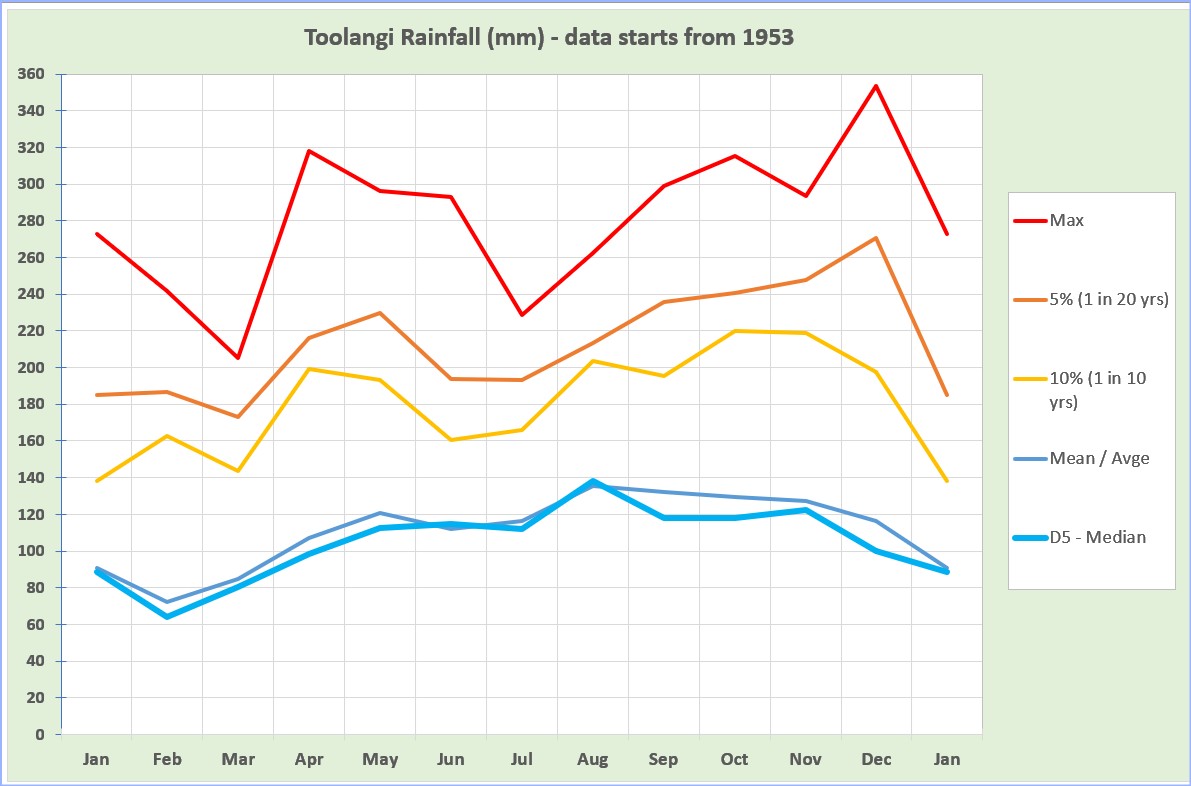
The graph below shows 70 years of rainfall data for Toolangi. The Median and Average Rainfall in spring is about 120 to 140 mm per month. However, this can get much higher. The upper 10% and 5% of spring months are almost double the average, at 200 to 24 mm per month. The maximum October rainfall was even higher, 315 mm fell in October 2022. This contributed to major flooding all along the lower Goulburn and the Murray River.
What does this mean for potential riders?
- The MDBP has changed the Goulburn River level pattern. The most likely time the stage 1 tracks will flood is now spring – particularly October and November.
- However, this won’t happen every year. At worst it will probably happen every 4th year or more.
- Riders should check Goulburn River levels online in advance when they are planning their ride. If levels look like going to 6m or have been above that level recently, be very cautious.
- Rainfall in the ERI area itself does not have much impact on Goulburn River levels. The area is too flat. Instead, riders should focus on Toolangi region rainfall to get an early warning of flood risk.
- When there is a risk of stage 1 being flooded riders can still ride the ERI.
- Ride other stages as single stages or combine them.
- Use the wet weather alternative route to avoid the flood prone areas of stage 1.
Use the following links to monitor Goulburn River levels:
- Water Releases from Lake Eildon. Water releases for environmental flows or irrigation can cause more flooding of Goulburn River ERI tracks than local rainfall.
- Goulburn River at Shepparton. The local floodplain ERI tracks are usually dry if the river level has not been above 6 metres recently.
- Goulburn River at McCoys Bridge. McCoys bridge is about half way between Echuca and Shepparton. The local floodplain ERI tracks are usually dry if the river level has not been above 6 metres recently.
.
Murray River Flooding
Flooding of the ERI tracks along the Murray River is likely to occur only once every 5 to 10 years.
If the Murray River floods upstream of Barmah these flood waters do not impact the ERI tracks. The Barmah choke is too narrow for the flood waters to get through. So the Murray River backs up and the flood water flows into the Edward River anabranch instead. This water is then likely to flood into the wetlands near Mathoura in NSW.
The ERI tracks along the Murray River may still be flooded. However, this is most likely the result of flood inflows from the Goulburn River. The best predictor of this is again monitoring levels of Goulburn River at McCoys Bridge.
.
Campaspe River Flooding.
Flooding of the ERI roads along the Campaspe River is likely to occur only once every 10 to 15 years.
The Campaspe River floods occasionally. Again this is because of heavy rains in the southern headwaters of the catchment (around Kyneton and Trentham). Once Lake Eppalock is full the excess water spills and flows quickly to join the Murray River at Echuca. This fast moving water can overflow the channel and cause major flooding. Rochester has been hit several times over the years.
The ERI roads running parallel to the Campaspe River are unlikely to be affected unless there is major flooding. This is different to the floodplain tracks on stage 1. On stage 1 the tracks are affected even before the river reaches minor flood levels.
The best sites to monitor the likelihood of major flooding on the Campaspe River are:
.
Outro
Thanks for reading and your interest!
The fastest way to contact me and get a response is to make Comments here. I get a personal message email whenever anyone posts a Comment here and try to respond quickly. Access to the comment section is set so anyone can use it. You don’t have to login or give any personal details. Just type your thoughts.
You could send me an email using this email address (nixtrader AT yahoo DOT com DOT au). However, this email address is rarely used and I don’t monitor it frequently.
.
